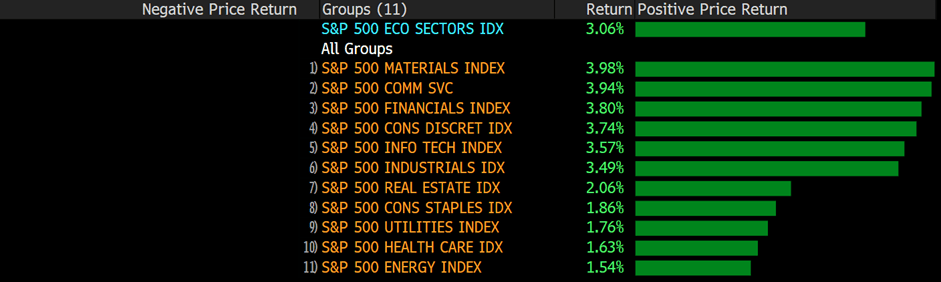
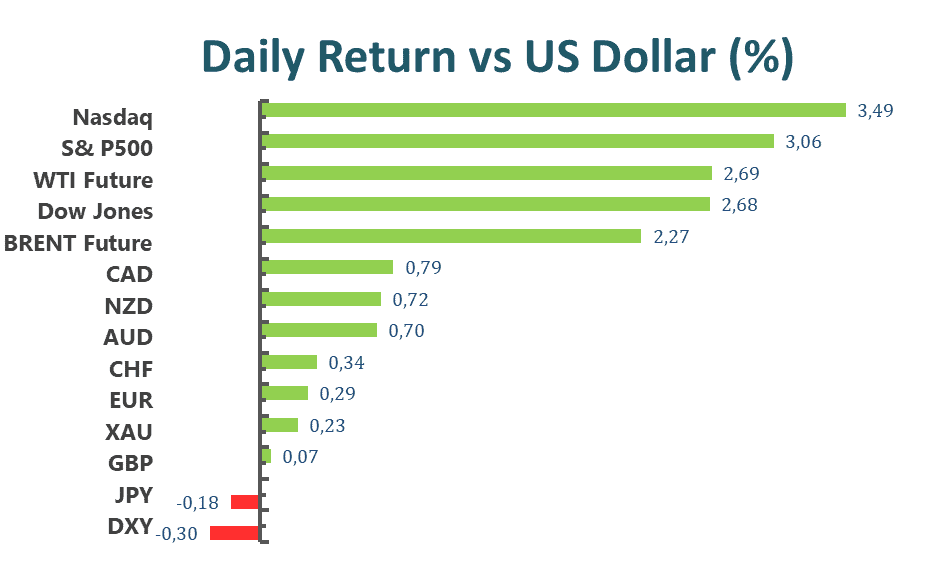
US shares rallied on Friday, rebounding off the lows of the bear market. In the meantime, the bounce-back of the US shares capped its first weekly advance since May. The Dow Jones Industrial Average advanced 2.68%, 823.32 points. The S&P 500 jumped 3.06%, and the Nasdaq Composite rallied 3.34% to 11,607.62 on Friday. All three major indices snapped the losing streaks as investors deliberated the idea of whether stock markets have been oversold and have hit a bottom; however, several investment banks remained pessimistic outlook. Moreover to the US economic data, the US Consumer Sentiment from a University of Michigan survey hit a record low of 50 in June; a gloomy consumer sentiment means that the demand for goods and services has decreased, impacting the entire economic ecosystem, including corporates, employment opportunities, and the stock market.
Over the weekend, G-7 countries announced that they will ban the import of Russian gold, so-called gold sanctions. According to US President Joe Biden, world leaders need to work together against Russia as the invasion of Ukraine by Russia has brought and caused painful and serious impacts on food and energy supplies across the world. Imposing gold sanctions on Russia might cause a severe impact on Russia as Russia has used gold to support its currency as a way to circumvent other sanctions. One example would be swapping the gold for a more liquid foreign exchange that is not subject to sanctions from other countries.
Main Pairs Movement
EUR/USD edged higher, up 0.38% on Friday. The greenback was unable to gather bullish momentum amid the concerns of an economic slowdown in the US. In the meantime, the ECB pointed out that it would have to aim for large interest rate hikes since its monetary policy has fallen behind. Thus, the euro-dollar got boosted.
USD/JPY moved upside after the release of Japan’s inflation. The core CPI in Japan jumped to 2.1% in May, the second consecutive jump. With the BOJ continuing to keep its ultra-loose monetary policy, the Japanese Yen weakens against the greenback. On Friday, USD/JPY was up 0.17%, finishing at 135.16.
Gold was up 0.25%, and closed at $1,827.31 on Friday. The precious metal was comparably stronger than the greenback as the greenback lost some interest amid cooling hawkish expectations from the Fed.
AUD/USD was up 0.7%, trading at 0.6942 at the end of the day. The Aussie rallied as the demand for the US dollar decreased resulting in the risk sentiment. In the meantime, during the testimony of Fed Chairman Jerome Powell, he pointed out that the possibility of raising rates would be based on the incoming economic data and the outlook of the economy; thus, slightly dovish hawkish comments brought the US dollar down.
Technical Analysis
EURUSD (4-Hour Chart)
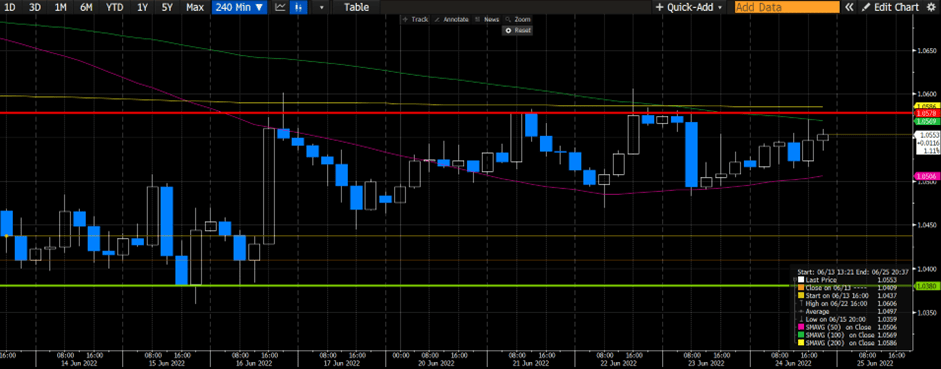
EURUSD gained 0.38% over the last trading day of the week to end the week in positive territory. Depressed PMI data from Germany and the Euro area has added concerns over an impending recession in the EU and uncertainty about the ECB’s abilities to tame inflation and support economic growth. On the economic docket, ECB President Lagard is set to speak on the 28th and Fed Chair Jerome Powell is set to speak on the 29th.
On the technical side, EURUSD continues to trade below our previously estimated resistance level of 1.05754. Selling pressure remains strong around this level. RSI for the pair sits at 55.93, as of writing. On the four-hour chart, EURUSD currently trades above its 50-day SMA, but below its 100 and 200-day SMA.
Resistance: 1.05754, 1.06315
Support: 1.0382
GBPUSD (4-Hour Chart)
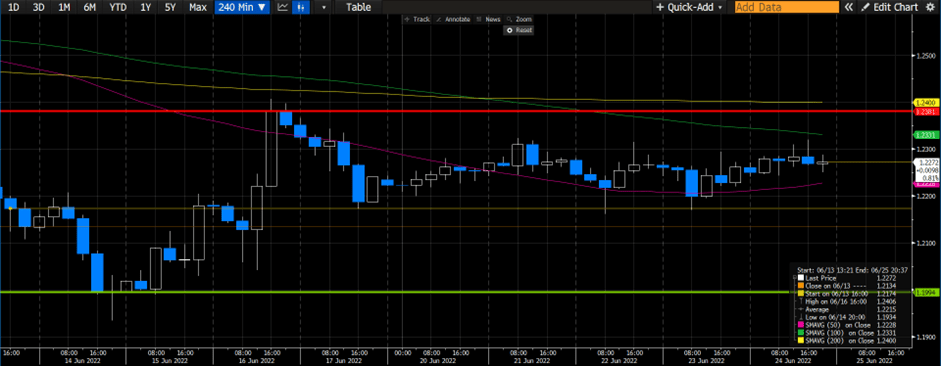
GBPUSD traded sideways over the last trading day of the week. Cable ended the week with a 0.44% gain. U.K. retail sales declined by 0.5% monthly in May, thus hurting some of the demand for the British Pound. On the economic docket, British GDP figures are set to release on the 30th, after BoE governor Bailey’s speech on the 29th.
On the technical side, GBPUSD continues to trade below our previously estimated resistance level of 1.2381; on the other hand, support levels for Cable remain firm at 1.2173 and 1.20824. RSI for the pair sits at 44.58, as of writing. On the four-hour chart, Cable currently trades below its 50, 100, and 200-day SMA.
Resistance: 1.2381, 1.25047
Support: 1.2173, 1.20824
USDJPY (4-Hour Chart)
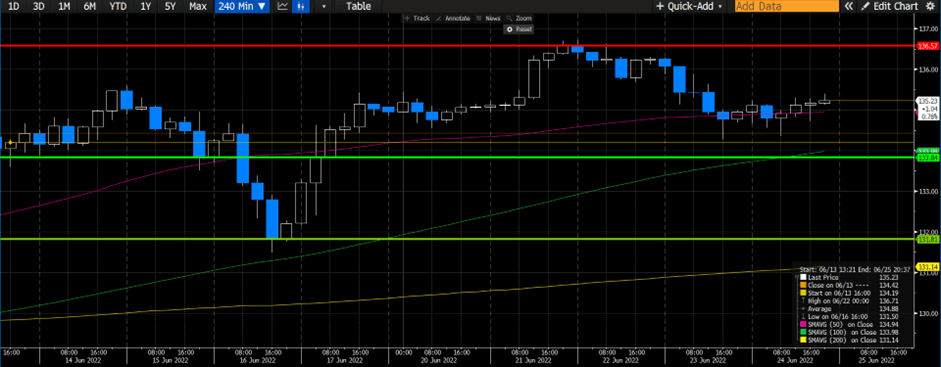
USDJPY gained 0.17% on the last trading day of the week to close the week in positive territory despite experiencing strong pullbacks on Wednesday and Thursday. The bullish sentiment continues to surround USDJPY as interest rate differences between the U.S. and Japan continue to overshadow any sort of fundamental news effects. On the economic docket, Japan’s Tankan large non-manufacturers index is set to release on the 30th.
On the technical side, USDJPY has found new support at the 134.76 price region and continues to trend upwards. The resistance level at 136.57 has not been challenged since Wednesday. RSI for the pair sits at 61.73, as of writing. On the four-hour chart, USDJPY currently trades above its 50, 100, and 200-day SMA.
Resistance: 136.57
Support: 133.84, 134.76
Economic Data
| Currency | Data | Time (GMT + 8) | Forecast |
| USD | Core Durable Goods Orders (May) | 20:30 | 0.3% |
| USD | Pending Home Sales (May) | 22:00 | -4% |

This site uses cookies to provide you with a great user experience.
By using eu.vtmarkets.com, you accept
our cookie policy.


![]()
Follow us on:


