Daily Market Analysis
Market Focus
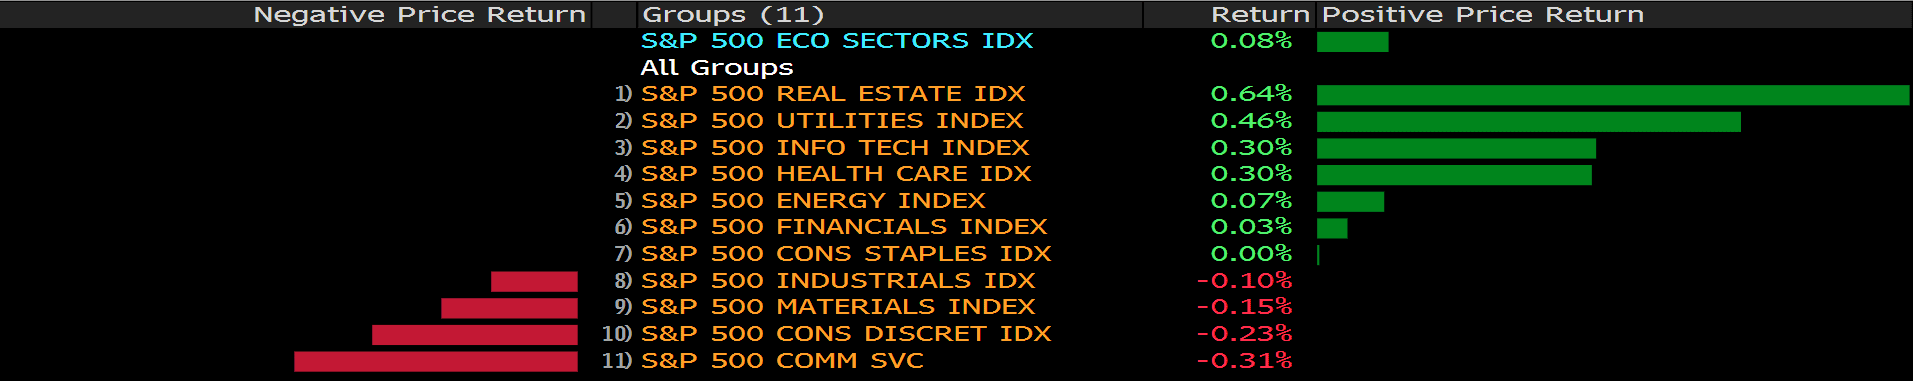
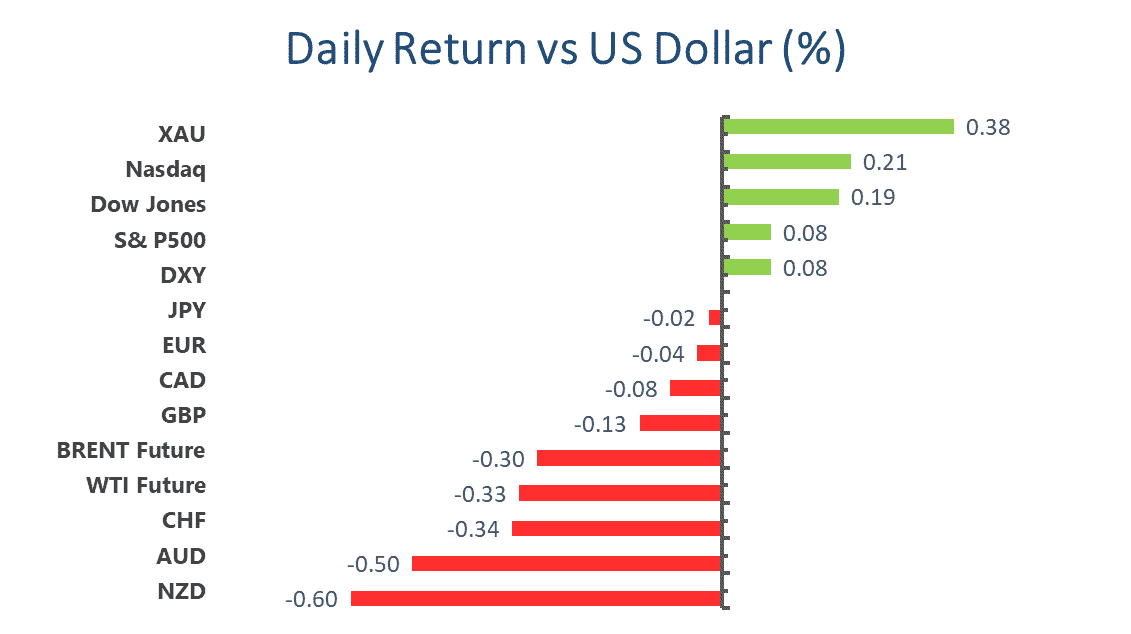
US equity market edged higher amid President Biden’s generous fiscal spending budget announcement of $6 trillion in 2022. The tech heavy Nasdaq 100 index up 0.2% and the Dow Jones Industrial Average index marched 0.3% on the last trading day in May, trading session will be closed next Monday as US is on Memorial Day. The S&P 500 index climbed 0.12%, with Real Estate and Utility share led the gain.
In more than 1700 spending proposal, the budget illustrates Biden’s ambitious vision to restore the nation’s infrastructure, expand the social safety net and combat income inequality with an overwhelming $6 trillions. This spending will come at a cost of significant tax increase on corporations and top earners. Former Treasury Secretary Lawrence Summers criticized Biden’s budget is built on outdated economic forecasts and risks overheating US economy.
Bitcoin wiped out most of this week’s gain as BoJ’s Governor Haruhiko Kuroda warned about the token’s volatility and speculative trading. The leading currency lost 8% to trade around $35,400. He commented that Bitcoin is ‘barely used as a means of settlement.’ space has been under pressure from regulators’ criticism around the world, especially in China, where Bitcoins have been mined the most.
Main Pairs Movement:
The US dollar index jumped as much as 0.32% amid President Joe Biden’s 2022 budget release, but momentum quickly ran out of gas, all gains were pared in the end. Inflation in the US advanced forward, with annual Core PCE Price Index, the Federal Reserve’s preferred gauge of inflation, jumped to 3.1% from 1.9% and surpassed the market consensus of 2.9%.
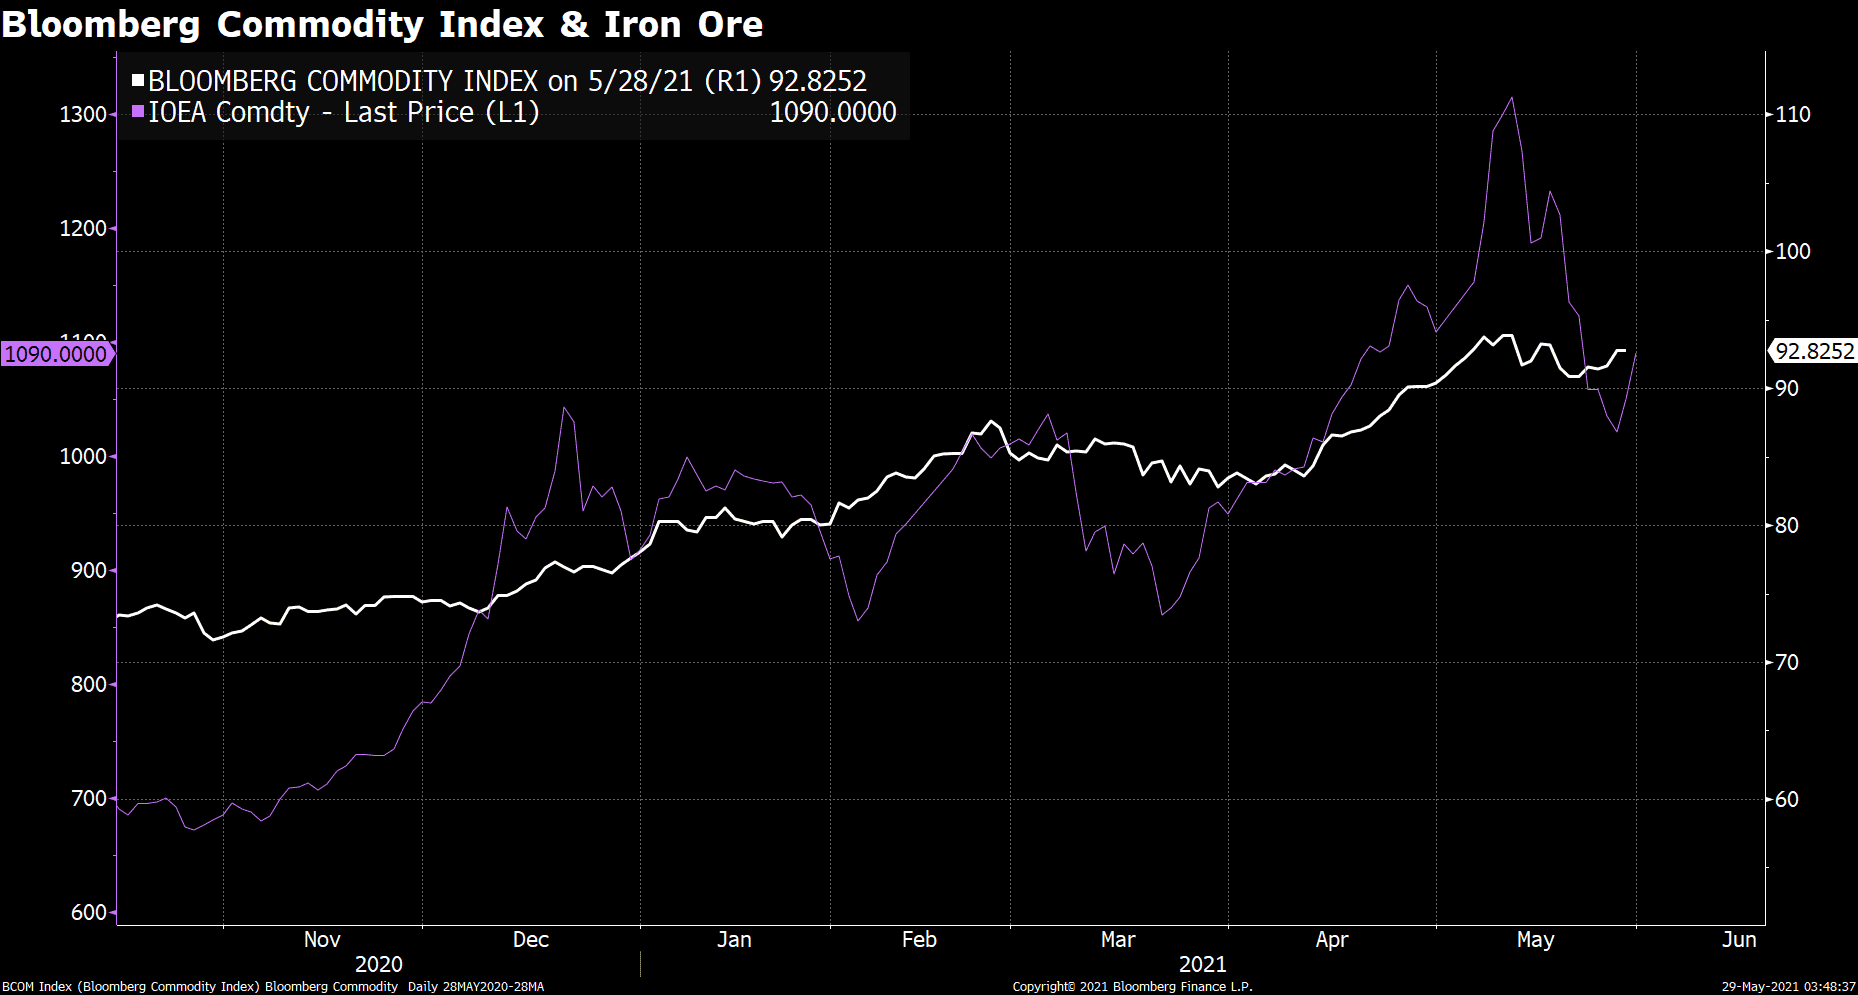
Aussie remains subdued given China’s attempt to repress commodity prices, losing 0.5%. The iron ore prices tracked by Bloomberg has indicated a 23% retracement from its high. The commodity index numbers have been moderated but remain close to recent high.
The Cable retreated 0.13% and is still unable to 1.421 hurdle yet. There are concerns that UK won’t be able to fully re-open its economy later in June. Investors need to pay close attention to potential Indian variant that could derail the full reversal from lockdown schedule for June 21st.
Technical Analysis:
GBPJPY (Weekly Chart)
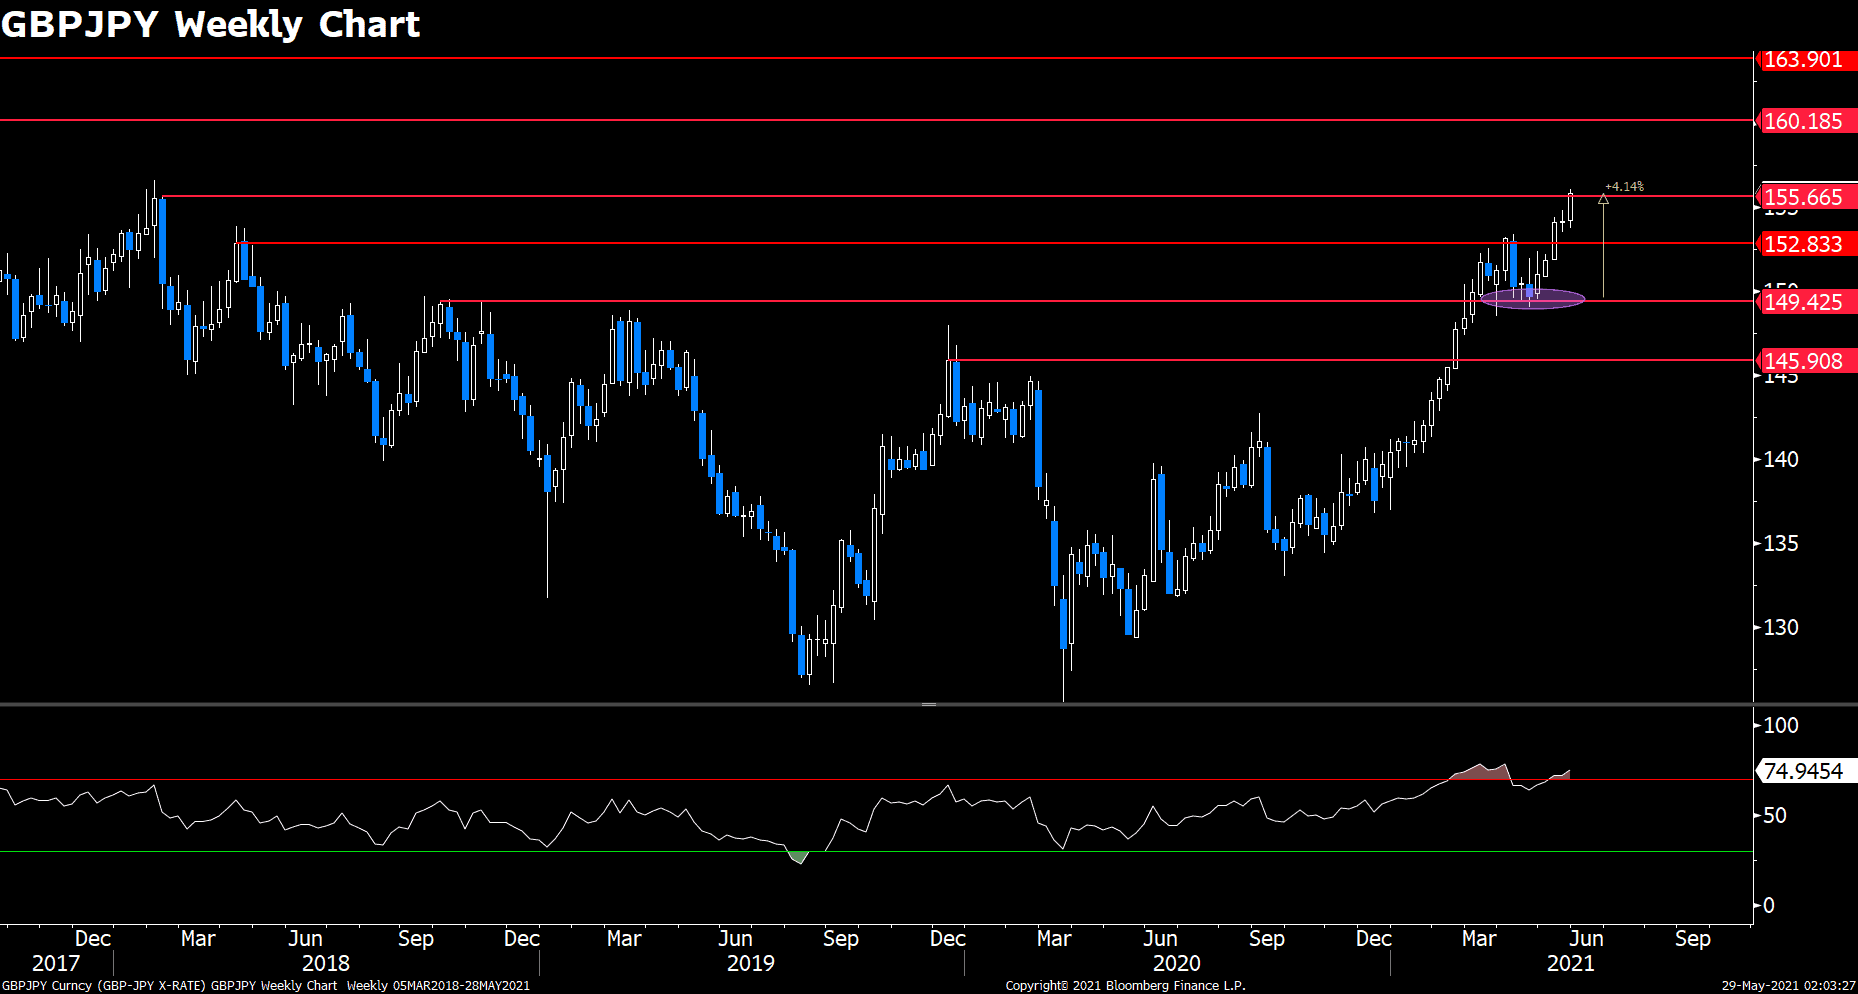
Can anything stop the GBPJPY rally at all? The pair is on another rampage after taking a breather around 149.4 support, climbed 4.14% in the past five weeks. It is currently trading at 2018’s high of 155.67, though it will not be taking down this roadblock this week, but nothing is guarantee for next week. Given recent strong fundamental from the UK and quite the contrary in Japan, there is really little for GBPJPY to holdback, not even the overheating signal from RSI at 75. Looking upward, it could run into 160.18 and 163.9 resistance lines dated back to 2016.
Resistance: 160.18, 163.9
Support: 149.43, 152.83, 145.9
EURUSD (Daily Chart)

Euro dollar attempted to launch another attack to the 1.2175 support, but was quickly fended off. The downsides were heavily guarded by bidders, resulted in a long tail wick on the daily chart. Seeing a huge rejection to the downside, trader may just decide to abandon their shorts and ride with the upward wave. This pair has been residing within the upper Bollinger band since early April and will continue to do so unless we a break lower from the mid-line, which marks SMA20. On the upside, bulls look to contest 1.235.
Resistance: 1.235
Support: 1.2175, 1.195, 1.171
XAUUSD (Daily Chart)
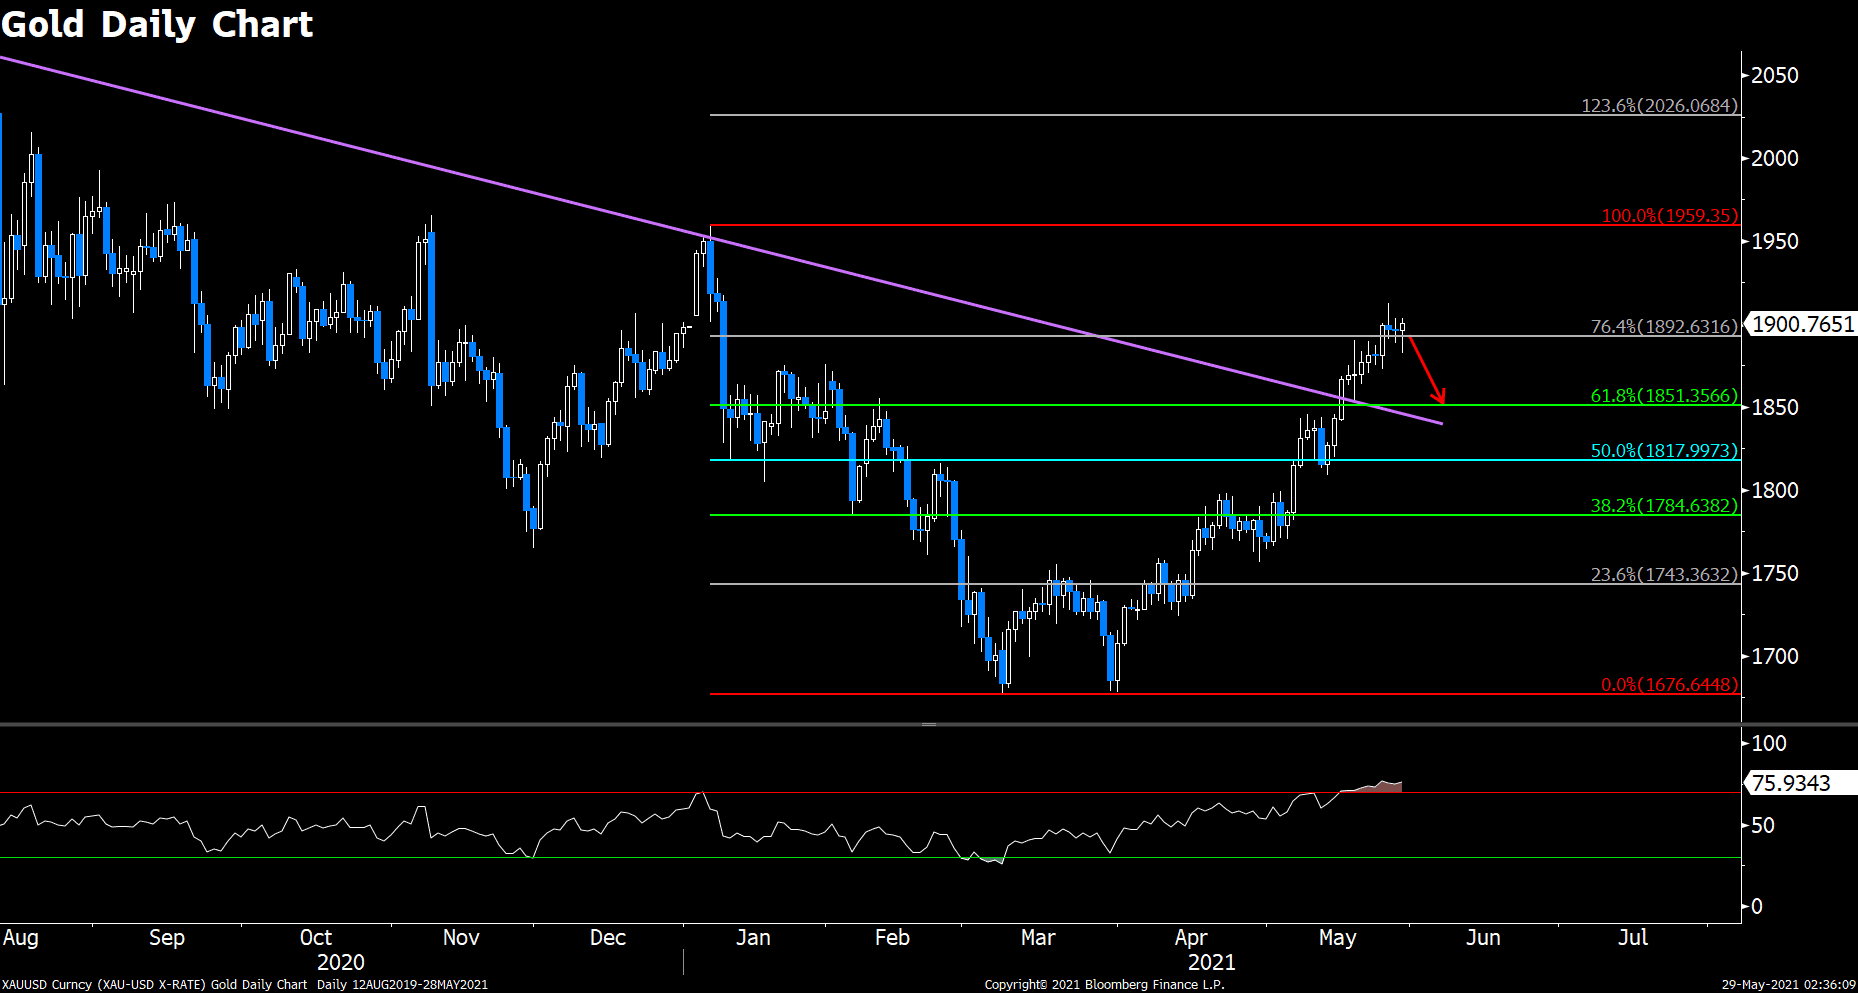

Price of Gold just refuses to backdown, currently clinging to the $1900 handle. The resilience in the precious metal is attributed to institutional inflows like hedge funds and ETFs, we are seeing a bottom-out in Gold ETF holdings. If the sideway trading carries on for another week or so, there is a chance that market is brewing for some radical moves given the recent concerns in the money market, the initial reaction could be a spike, followed by opposite plunges. On the upside, there are quite some open spaces to capitalize on, the nearest resistance lays around $1955, next to a big round $2000. Overheating condition in the RSI continues.
Resistance: 1955, 2000
Support: 1847, 1815, 1782
Economic Data
|
Currency |
Data |
Time (GMT + 8) |
Forecast |
||||
|
CNY |
China Manufacturing PMI (May) |
09:00 |
51.1 |
||||
|
EUR |
German CPI (MoM) (May) |
20:00 |
0.3% |
||||

This site uses cookies to provide you with a great user experience.
By using eu.vtmarkets.com, you accept
our cookie policy.


![]()
Follow us on:


